Note
This part of this article covers the accessibility and consumption, the "AC" end of the PAC Model. This helps explain the issues of importance that recognition of the predicament of each individual or family represented by the challenge of consuming what they need against changes in the purchasing power of their disposable income (real disposable income) and changes in the prices of goods and services. The solution to this predicament lies on the supply side and on how "producers" managed productivity, unit costs, margins and make products and services available at accessible prices.
The second part, in preparation, will set out the supply side mechanics and decision-making for production to establish explain the "P" end of PACM. |
|
|
Keynesianism, monetarism and supply side economics make use of policy instruments to influence what is referred to as aggregate demand. This operates on the basis of a general assumption that company activities respond to increasing or decreasing levels of demand. The Aggregate Demand Model considers any increase in size of the nominal GDP to represent growth. However, if one cares to refer to the main foundation texts on Keynesianism, monetarism and supply side economics there is almost no mention of the main sources of economic growth. Some 60% of economic growth is derived from advances in:
- learning
- technology
- technique
- the accumulation of tacit knowledge
- the accumulation of explicit knowledge
|
All of these elements contribute to the shaping of successful innovation and this is the key to growth. Now in spite of the fact that these observations are well-established, conventional policies struggle with an inability to provide positive incentives to promote enhanced productivity. In addition because of the the profit paradox (see
"The profit paradox") and government revenue-seeking there is a policy-induced systemic tendency for conventional policies to undermine productivity. Conventional policies therefore fail to reduce income level disparities because the growth and distribution of real incomes is largely ineffective. Conventional macroeconomic policies and the profit paradox interact to equate higher prices or higher nominal profits or demand with growth when such growth is undermined by policy-induced currency value depreciations caused by:
- inflation
- the diversion of money growth into assets (as is occurring currently under quantitative easing and so-called austerity policies)
- monetary policy setting 2% inflation as a medium to long term policy target in support of "price stability" resulting in a currency depreciation of over 18% each decade
The misguided monetary strategy of assuming inflation is caused by excess demand can be seen to be without basis in the current circumstances when quantitative easing and low interest rates have encouraged banks to take advantage of the situation to finance commodity and asset investment with investment for productivity continuing to decline. The financing of corporate share buy backs is inflating the stck markets to the benefit of executives while productivity and workforce wages stagnate. As a result, inflation advances while real income decline.
In order to prevent such declines in real incomes it is necessary to concentrate on the pricing mechanisms of economic units. It is pricing policies that cause inflation, not the volume of money in the economy.
The PAC Model in practiceThe Production, Accessibility & Consumption Model considers productivity, expressed in terms of physical productivity and competitive unit pricing, to be the motor of economic growth. This perspective emphasizes the importance of supply side decision-making at the level of each economic unit. The decision analysis used to select unit prices relates to how to improve productivity by taking into account the relative prices of inputs and the estimated price elasticity of consumption (pEc). The pEc is the degree by which consumption increases with unit price reductions. Therefore management needs to establish prices that gain the best compensatory corporate revenue. It should be noted that this implies a different decision analysis with respect to the classical theory concerning resource allocations and the marginal distribution of incomes. This is because of the additional considerations that are required with respect to the dynamics introduced by pEc. Under this regime companies are no longer "price-takers" but operate as "price-setters". This complicates decision-making because more extensive information is required upon which to base decisions. However, the attainment of a more efficient allocation of resources is the basic outcome.
Many companies in such activities as information technology benefit from high volume output to secure the benefits of the learning curve, falling unit costs with scales of production and technological innovation contributing to significant reductions in unit costs and increases in quality. As a result unit output prices can be significantly reduced so that people, who previously could not afford such products, can purchase them and, as a result, sales volumes increase and real incomes rise. There is another dimension to this. Besides reducing the acquisition costs of existing products and services, innovative companies also launch products for which there is no current known demand because the products themselves do not yet exist. In these cases we can only speak in terms of latent or potential demand. Thus companies spend time procuring resources and producing products or services for which there is no current demand. Therefore one of the most significant growth areas of the economy is where there is no certainty of demand but companies have estimated that latent demand will convert into a significant level of actual consumption so as to establish a quantified level of "demand". Therefore to regard aggregate demand as the explanation for current levels or values of economic activities is a flawed concept.
If one is primarily concerned with economic growth in real terms it is essential that policy encourages innovation and the production of new products or at least better quality products associated with lower unit prices. This is only feasible if productivity is increased. The PAC Model is based on this concept in that if production of a new product or service occurs then consumption will increase if the product or service is accessible from the standpoint of each of the following three attributes:
- information - people are aware of the existence of the new product/service and its price
- location - the product or service is available at the location of consumers and the product or service can be supported locally
- price - unit prices need to be accessible, that is, can be purchased using current disposable real incomes
In the case of existing products where consumption patterns are well understood and quantified, growth can still be secured through innovation that leads to a better quality of an accessible product or service as well as by lowering unit prices. Thus where there is an existing "demand" growth can be generated through improvements in quality and prices.
Better real income distributionThe price elasticity of consumption has an important role in levering the real income distribution effect. As unit prices fall there is a real income enhancing impact because more can be purchased for a fixed nominal income. If the trend is unit price declines then the real incomes income distribution effect becomes more generalized. This income distribution impact is even the more significant and widespread to the degree that all of the accessibility conditions of the PAC Model are met (accessibility to product and service information, accessibility of product or service and required support locally and accessible prices). The effective force in securing lower unit prices and generating consumption is productivity. The measure of the relative success of a company in generating more accessible unit output prices can be measured using the price performance ratio (PPR) (See
"The price performance ratio").
Real as opposed to imaginary productivityCorporate productivity under the PAC Model is expressed as increases in revenue resulting from more effective and competitive pricing made feasible as a result of real increments in productivity. The Real Incomes Approach to economics builds upon these relationships by eliminating two factors that undermine efficient resources allocation. The profit paradox is eliminated by substituting profits by investment in technology and human resources with the return on investment being measured in terms of the real incomes of shareholders and employees and by removing corporate taxation from consideration in microeconomic allocation decisions by eliminating corporate taxation altogether.
Driving productivity through policyConventional economic theory (Keynesianism, monetarism and supply side economics) and derived policies, have no explicit roles for the main sources of economic growth in the form of learning, advances in technology and technique, the accumulation of tacit and explicit knowledge and innovation.
Development finance
After some 40 years working in international development projects it is more than apparent that most grants and international loans do not perform. Indeed an internal report at the World Bank showed that 60% of their loans were not performing as expected and 25% were failing. On the donor grant front few projects secure the outcomes expected. In all cases conditionality is based on the credibility of those selected to manage projects and a range of assumptions on their ability to marshal resources to achieve objectives. In such an uncertain environment, many grant applicants, including institutions and NGOs regard the application process as one to qualify to obtain income as opposed to secure investment resources for the stated purpose.
The currently weak project cycle management techniques do not provide a sufficiently robust oversight to avoid projects failing because of an inability to respond to inevitable changes in the environment during the course of projects and which affect outcomes. |
|
|
Where "policy" attempts to tackle such issues use is normally made of ad hoc "initiatives" by "departments" of "industry", "business" or even "innovation" and including grants, subsidized loans and tax allowances designed to encourage investment in innovation or research and development. But what is very obvious it that such initiatives are not a part of the organic functions of any of the main conventional macroeconomic theories or policies. They are "add-ons" which invariably will be changed according to the inevitable lack of traction of conventional policies.
An additional and fundamental problem with such "initiatives" is that conditionality clauses governing them are usually weak as in the case of many development grants where monies are advanced "in the hope" that the desired outcome will be achieved. It is more than apparent that for many grant recipients the name of the game is to use the grant as income (see box on the left). There is a need for grants to be forthcoming only when desired outcomes are achieved. This might sound like an impossibility but how this type of conditionality can operate in practice, is explained under the section heading "Conditionality" below.
The Real Incomes approach to policy-makingThe Real Incomes Approach to economics is the only theory and policy set that explicitly embeds the main sources of growth in the macreoconomic theory in support of policy propositions to lever these to enhance growth. A specific real incomes policy option, Price Performance Policy, is based on a proactive conditionality. The economy is assumed to operate on the basis of the PAC Model so emphasis is placed on production performance and in particular unit price accessibility. This therefore places an emphasis on resource allocation decision analysis that seeks to maximize the benefits from price elasticities of consumption of different products and services associated with different consumer segments, each with different levels of disposable income.
The PAC Model step by step sequence
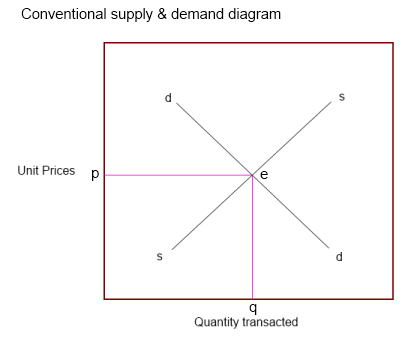
If the unit cost curves of production or service provisions by companies are combined one ends up with an aggregate unit costs curve that falls in association with throughput, achievement of best practice and general productivity. Figure 1 shows the conventional supply and demand curve which provides little information on the state of consumption needs of the population because "demand" is only the transactional turnover of consumption. It is therefore useful to build up the profile of consumption patterns.
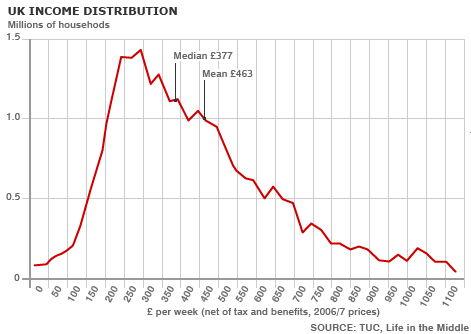
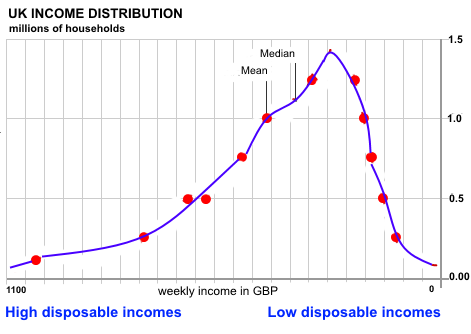
Figure 2 shows the distribution of family incomes in the UK and Figure 3 shows the same graph to place lower income families on the right hand side.
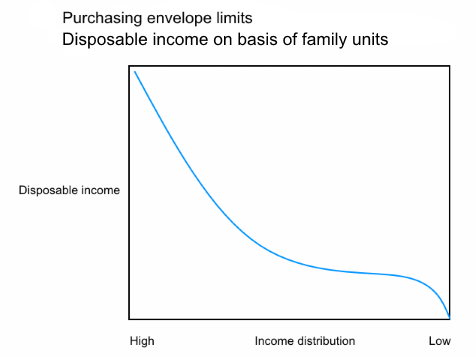
By multiplying disposable income per family by the number of families in each disposable income category a "purchasing envelope" can be generated which shows the size of the market associated with family income levels as shown in Figure 4.
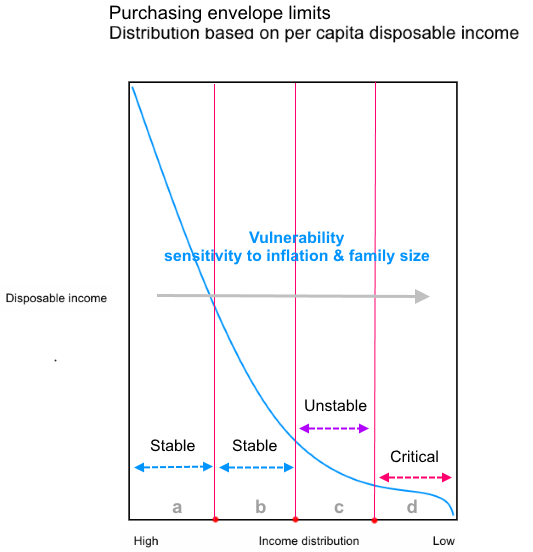
By dividing per family disposable incomes by family size a per capita disposable income is generated as shown in Figure 5. In Figure 5 the situation of lower per capita individuals becomes more clear as one of marked disparity with higher per capita individuals. In lower income segments in low income countries the situation is considerably more precarious.
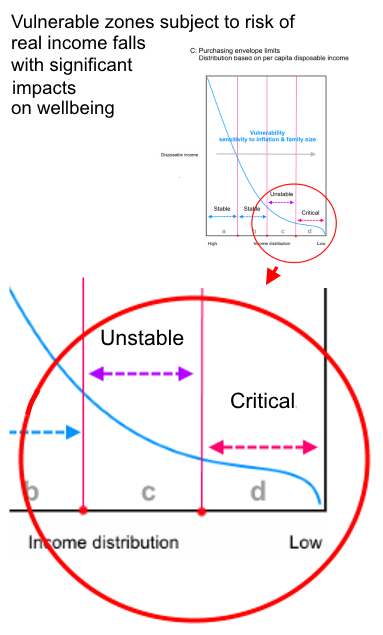
The focus in Figure 6 is on the lower level tail end of per capita incomes because this segment is fully exposed to the erosion in purchasing power caused by inflation.
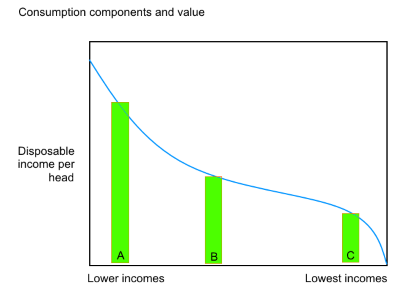
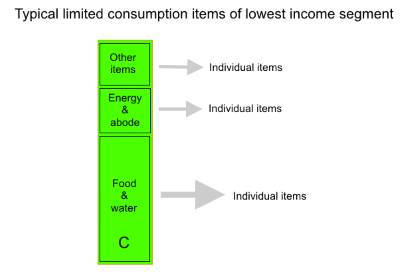
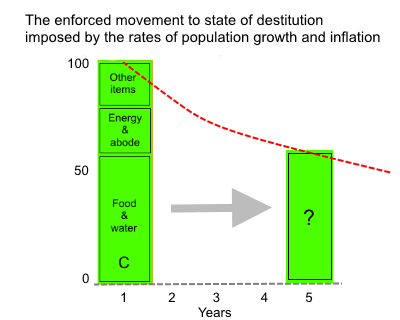
Figure 7 reflects the fact that the differences in per capita disposable incomes enables the acqusition of different combinations of goods and services. The areas A, B, and C eflect completely different consumption capabilities even within the lower income segmeents. The middle income groups spend perhaps 20-25% of their income of essentials such as food and the rest on a combination of products including consumer goods. Figure 8 reflecte the fact that the lowest income groups spend increasing amounts of their incomes of food, which for the lowest income levels might be 60% of their disposable income.
As a result, purchasing power falls as a result of inflation, threatens their very existence.
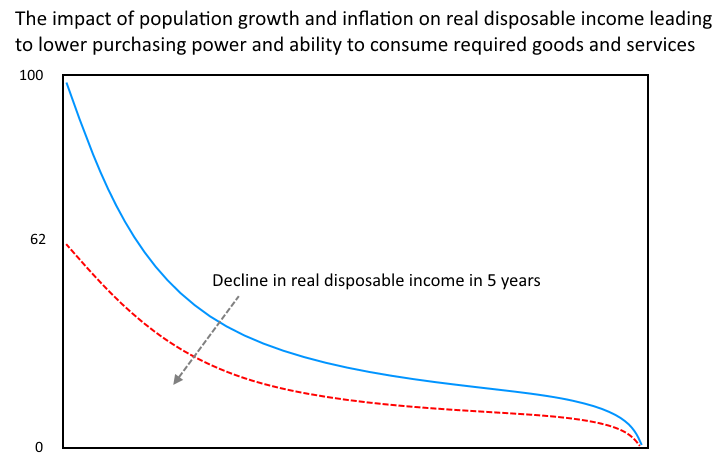
The real incomes erosion treadmillIn low income countries and lower income families there is often a higher birth rate and also higher inflation rates. The relationship between real incomes growth, nominal incomes, population growth and inflation is provided below:
dR = dN � dP - dI �����.. (i)
or
dR = dN � (dP + dI) �����.. (ii)
Where:
dR is the growth in real income;
dN is the growth in nominal income;
dP is the population growth rate;
dI is the inflation rate or rise in average unit prices.
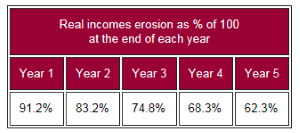
The impact of population growth and inflation can be dramatic. For example a typical inflation rate in an East African country of 6% and natural population growth rate of 2.8 will result in a reduction of purchasing power of 8.8% each year which is equivalent to a decline in purchasing power of the currency of 37% in 5 years. For real incomes to rise over this period would require a rise in nominal incomes, over the same period of at least 37%, or an annual increase in excess of 8.8%. The table below indicates this rate of purchasing power erosion which rapidly reduces income to below levels necessary to sustain the consumption of essential products such as food.
Table 1
Real incomes erosion as % of 100
at the end of each year |
| Year 1 | Year 2 | Year 3 | Year 4 | Year 5 |
| 91.2% | 83.2% | 74.8% | 68.3% | 62.3% |
Policy incentiveThe policy challenge is to create a positive incentive to encourage company shareholders and workforce to pursue the trajectory t-t in Figure D. However, clearly this needs to be financially viable for economic units. Under conventional profit-orientated decision-making, there are risks associated with unit price reductions because of reduced margins and there is usually uncertainty with respect to the price elasticity of consumption. Therefore any increases in revenue achieved, if any, resulting from a unit price reduction and squeezing of margins remains uncertain. Certainly under a profit-orientated regimes is based on the maximization of short to medium term profit margins in order to maintain or raise "return on investment". This, however, comes at a higher general reduction in the macroeconomic benefits associated with the profit paradox. (see
"The profit paradox"). If companies are able to allocate resources in such a way that productivity increases are measured by reduced unit costs, then price reductions are feasible with margins remaining the same and returns on investment can remain stable or even rise. This becomes less of a constraint if profits are substituted by real incomes and, indeed, overall productivity and revenues can be substantially increased as a result. The purpose of the Real Incomes Approach is to maintain policy traction for increased real incomes by providing systemic incentives for companies to sustain unit price reductions and increase or maintain the value of the currency.
The best example of a real incomes policy option designed to achieve this is Price Performance Policy (PPP). Under PPP the policy instrument used to measure corporate performance is the price performance ratio (PPR) (see
"The price performance ratio") and this indicator is used to calculate a price performance levy (PPL) to be paid by the company (see
"The Price Performance Levy") on margins. In order to eliminate the negative impacts of the profits paradox, the legal accounting framework would not have any profits category nor any role for corporate taxation. Indeed, profits and corporate taxation have no constructive role in any decision analysis leading to effective resources allocation able to achieve a positive systemic consistency at the macroeconomic level (see
"Positive Systemic Consistency"). Companies that have PPRs of less than one (absorbing or reducing inflation) pay a progressively lower PPL with the difference between the maximum PPL and zero being allocated as a bonus for all associated with a company and paid pro rata in proportion to base salaries. PPRs measure the response of unit output prices to variations in unit input costs. Where unit input costs are rising then if the unit output prices rise by less than the rise in unit input costs in percentage terms the PPR will be less than unity (<1.00). The fundamental difference between this economic theory and policy and conventional economics is the positive control of the policy over the policy targets of increased real incomes, secured through unit price reductions, and, significantly, the maintenance of the currency value.
ConditionalityThis system embeds productivity enhancement into the organic macroeconomic framework on a permanent basis. Conditionalities of the types established under grants and "add-on initiatives" is replaced by an assessment of actual price performance and realized productivity gains based on the PPP corporate accounting framework which is used to determine the levels of PPL to be paid, and net of transaction incomes. This control is exercised through a conditionality related to a precise measurement of increased productivity as reflected in actual unit prices used in transactions. On this basis companies can benefit from a positive incentive based on a transparent and justified monetary compensation. The monetary compensation is designed to reduce the risk associated with operational unit price reductions as opposed to promises or paper accounting statements. This system is not a subsidy since the monies involved are those generated by each company.
And supply & demand?....
It should be noted that the transactional envelope of the PAC Model calls into question the logic of conventional supply and demand diagrams and in particular the limitations of these in supporting rational dynamic analysis.
An article on this specific question will be posted soon. |
|
|
Driving growth and innovationThe PAC Model and the transactional envelope combine to provide a logical explanation that, at any point in time, those with higher disposable incomes are likely to lead the support for pioneer but often more expensive products and services. The objective of PPP is to encourage rational investment in technology and human resources and in particular a more effective analysis of required explicit information and more effective estimates of the trajectories of human resources performance arising from the accumulation of tacit knowledge. Careful resources allocation and the levering of tacit knowledge will result in a more effective use of resources leading to cost reductions (See:
Tacit & explicit knowledge). This has the effect of making lower unit output prices feasible leading to market penetration. This market penetration is accompanied by rises in the real incomes of both high income and low income sectors and this movement represents real economic growth. Therefore innovation sustains a virtuous cycle of renewal of opportunities to raise productivity and price-setting promotes growth by extending the distribution of real incomes. With time, the learning curve, returns to scale and yet more innovation in technology and techniques, helps further promote rises in real incomes and stability in the value of the currency rather than devaluations.
Public choiceAn fundamentally important factor in maintaining policy traction is to gain the support of the social and economic constituencies through the establishment of an objective that remains coherent at microeconomic and macreoconomic levels thereby establishing a basis for unanimous agreement. Unanimity, the basis for social and economic choice in a democracy, can only be sustained if a policy achieves benefits for all on a transparent basis, that is, a state of positive systemic consistency. This is a fundamental objective of constitutional economics where the constitutional framework works equally well for the state, society and the individual.
Conventional policies deploy arbitrary top down state interventions in financial and fiscal fields that are unable to accommodate the diversity of needs and conditions facing economic units and workforces in the productive and service sectors. The result is always the generation of winners, losers and those unaffected by policy. The Real Incomes Approach, in the form of Price Performance Policy (PPP), in stark contrast, avoids such top down arbitrary state interventions but places the decision making to manipulate policy variables of PPR and PPL in the hands of economic units and their workforces so that they can optimize resource allocation according to their specific access to resources and capabilities to their benefit and to the benefit of the whole economy. This is why policy traction can be achieved and why this approach is an example of a more constitutional economic framework based on direct decision-making by the economic and social constituencies.
ConcludingA more detailed explanation of the contribution of the PAC Model to raised real income distribution and employment can be accessed here:
"The Real Growth Multiplier".
One of the misnomers of supply side economics was its baptism as "trickle-down economics". However, under the Aggregate Demand Model and the impact of the profit paradox, income disparities increase, growth is weak and productivity stagnates. The experience in the USA was that lower income sectors, in particular, did not benefit (see
"Some evidence on the failure of supply side economics").
Under PPP the process is a "horizontal diffusion of real incomes" founded on productivity and rational output pricing by economic units. PPP is the only policy that makes use of the PAC Model as the mechanism to ensure that the economy operates to the benefit of all.
1 Hector McNeill is the director of SEEL-Systems Engineering Economics Lab.
Updated: 15th June, 2015 adding reference links within text;
Updated: 5th July, 2015 correcting link to profit paradox.
Updated: 10th December, 2015 adding detail to make statements more explicit - sense maintained.
Updated: 1st June, 2019, added the last four graphs - sense clarified
Updated: 12th June, 2019 - added note
All content on this site is subject to Copyright
All copyright is held by © Hector Wetherell McNeill (1975-2015) unless otherwise indicated