Hector McNeill1
SEEL
The construction of the significance of the PPR is contained in the archive material taken from McNeill, H. W., "Inflation - Its control through Price Performance Fiscal Policy2 - A Real Incomes Approach, Rio de Janeiro, 1976 and from the summaries and updated version McNeill, Price Performance Fiscal Policy - A Real Incomes Approach, HPC, December 1981. What is presented below benefits from feedback received from Professor Robin C. O. Matthews of Cambridge University who suggested that the PPR needed to include cases for deflationary conditions in addition to the original conditions that emphasized inflationary conditions. |
In analyzing data on the changes in real incomes or purchasing power of a specific quantity of currency, the relative changes in unit output prices need to be monitored and measured. More significantly, the real incomes approach to economics is concerned with the degree to which a company contributes to the general state of real incomes of customers, employees and ownership of the business.
A convenient measure of the degree and direction of contribution of a specific company to real incomes is the price performance ratio or PPR. This measures the % response of unit output prices to % changes in unit input costs. The PPR can be generalized to take as the "pointer" the direction of travel of unit input costs. If these are positive, that is, rising, or negative, that is falling, the objective of the PPR is to monitor the response of output prices to an equivilant and comparable ratio in either case. The purpose of the PPR coefficient is therefore to see by how much output unit prices rise in response to input unit costs rises. Clearly lower rates of unit output price rises contrinbute to a reduction in the upward pressure on prices. In the case of unit input cost declines there is an interest in seeing by how much unit output prices fall in response to indicate the degree to which benefits are passed on.
As mentioned above the "lead" is taken by the direction of travel of input unit costs. Thus there are two sets of PPR equations. One for rising unit input costs and one for falling unit input costs.
Under inflationary conditions
Thus under inflationary conditions the degree and direction in which a company influences price inflation is the Price Performance Ratio (PPR). The PPR can be measured as the ratio of the percentage increase in unit output prices to the percentage increase in total unit input values over a given period of time:
PPR = (100(dPo)/Po)/(100(dUC)/UC)
PPR = (dPo .UC)/(dUC.Po) ..... (1)
where:
dPo is the increase in unit output prices during the period and Po is the unit output price at the beginning of the period;
dUC is the increase in total input costs per unit during the period and UC is the unit input cost at the beginning of the period.
Under inflationary conditions
Thus under deflationary conditions the degree and direction in which a company influences prices can be measured as the ratio of the percentage fall in unit input costs to the percentage fall in unit output prices over a given period of time. Note that this is the inverse of the equation 1 above and it is therefore of the following form:
PPR = (100(dUC)/UC)/(100(dPo)/Po)
PPR = (dUC .Po)/(dPo.UC) ..... (2)
where:
dPo is the decrease in unit output prices during the period and Po is the unit output price at the beginning of the period;
dUC is the decrease in total input cots per unit during the period and UC is the unit input costs at the beginning of the period.
Desirable and undesirable states
The PPR provides an indication of the degree to which the supply chain individual firm activities impact real incomes as a result of the summation of unit input costs (transacted) and the unit output prices (transacted). This occurs across a transformation process including: input procurement (transaction), external input logistics, internal input logistics, transformation process, internal output logistics (product or services), product sales (transaction), external output logistics (product or services) and delivered product or service.
Inflation target zonesWith current technology, techniques and accumulated tacit knowledge, there is a frontier beyond which we cannot operate with state of the art technology (See:
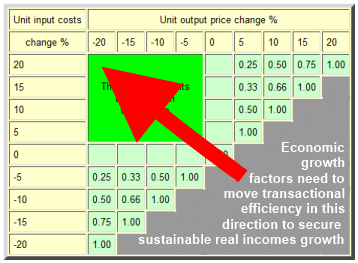
Tacit & explicit knowledge). For example if unit input costs rise by 20% it would normally be difficult to secure a 20% reduction in unit output prices without losing a considerable amount of money. However, through re-adaptations of state of the art, systems engineering and rational decision analysis it is possible to redesign processes and maximize process throughput so as to carry the evolution of technological and economic performance to enter the innovation target zones leading to a significant rise in supply side-generated real income as a result of lower unit prices and market penetration. The innovation target zones, desirable and undesirable states are shown in the table below.
Price Performance Ratios (PPRs)
associated with different unit input value movements & movements in unit output prices
| Unit input costs | Unit output price change % |
| change % | -20 | -15 | -10 | -5 | 0 | 5 | 10 | 15 | 20 |
| 20 |
This area represents
the innovation
target zone | 0.00 | 0.25 | 0.50 | 0.75 | 1.00 |
| 15 | 0.00 |
0.33 | 0.66 | 1.00 | |
| 10 | 0.00 | 0.50 | 1.00 | | |
| 5 | 0.00 |
1.00 | | | |
| 0 | 0.00 | 0.00 | 0.00 | 0.00 | 0.00 | | | | |
| -5 | 0.25 | 0.33 | 0.50 | 1.00 | | | | | |
| -10 | 0.50 | 0.66 | 1.00 | | | | | | |
| -15 | 0.75 | 1.00 | | | | | | | |
| -20 | 1.00 | | | | | | | | |
Innovation target zone | | Desirable states | | Undesirable states | |
|
This table provides a map of the distribution of likelihoods of sources of enhanced real incomes. However, the extent of real income generation at the macroeconomic level can only be estimated by applying sector demand schedules for local and regional markets. In the case of global markets, the elasticity of demand for price-setters is well above the market norm so the returns to lower PPR states are enhanced by market penetration, returns to scale, better procurement conditions and the accumulation of tacit knowledge leading to quantifiable increases in performance measured in terms of unit costs of production.
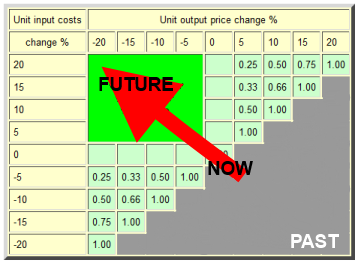
The PPR map is not only a useful guide to feasible attainment in terms of real income growth according to the sector/technologies but it also provides a map of targets for research and development and technology requirements. At all times these explicit descriptions will be improved, in practice, through the refinement of techniques, that is, the way people apply technology, achieved through practice and the further accumulation of tacit knowledge. The PPR map also provides an indication of the evolutionary transition of where we stand today in terms of the given past and the necessary future.
Why the Real Incomes Approach is differentThe Real Incomes approach makes use of such factors as critical policy and business rule resources. It makes use of them by influencing transactional behaviour to stimulate the proactive application of these growth factors. It is notable that the main conventional texts on Keynesianism, monetarism and supply side pay scant attention to these factors and as a result provide no basis for gaining traction and real economic growth when attempts are made to apply these theories as policy.
1 Hector McNeil is director of SEEL-Systems Engineering Economics Lab
2 The first versions of Price Performance Policy were presented as a fiscal policy but this was a logical mistake and a source of weakness since when successfully implemented government revenues fall to zero or to very low levels. In practice this is also what happened when supply side economics was applied under the Reagan administration in the USA but for slightly different reasons.
All content on this site is subject to Copyright
All copyright is held by © Hector Wetherell McNeill (1975-2022) unless otherwise indicated