Note 226/03/2023: This is an updated version of an original paper prepared by the Boolean Library. This version takes into account suggestions provided by H. W. McNeill of SEEL-Stystems Engineering Economics Lab to adjust content to the current state of knowledge concerning the Real Incomes Approach.
 The stagflation crisis 1973-1993
In 1973 the Organization of Petroleum Exporting Countries imposed sanctions on the major petroleum importers by raising the international price of petroleum.
This gave rise to stagflation, the combination of inflation and rising unemployment. Conventional economic theory and derived policies of Keynesianism and monetarism possessed no policy instruments to combat stagflation. All possible scenarios where the following instruments could be applied would create prejudice for constituents:
- Raising or lowering interest rates
- Injecting more funds into the economy or discouraging lending
- Government borrowing and expenditure
- Taxation to alter disposable incomes
3P-Price Performance Policy
What is described in this section is a general macroeconomic policy referred to as Price Performance Policy or 3P which can affect all sectors. 3P has the intent of encouraging reduction or moderation in price setting to enhance the purchasing power of wages and thereby raise real wages and total demand while alleviating cost of living issues. 3P facilitates this on a sustained basis by establishing an operational environment of incentives for sets all sectors off on a path of continuous rising productivity the enhancement in real incomes benefits the workforce as employees as well as consumers and also raises corporate ownership real incomes.
It is therefore relevant to a levelling-up policy able to reduce poverty through real growth as well as contribute to the reduction in income disparity between regions of the United Kingdom. |
|
|
In 1975, the economist Hector Wetherell McNeill aware of these drawbacks, reviewed economic theory and policy propositions to identify a way to tackle stagflation.
By 1976 (See Note 1), this effort resulted in a set of observations and logical principles that explained why conventional instruments could not solve the stagflation issue.A sustainable industrial policy
Governments are not good at selecting activities and sectors requiring development. This is best left to management and works forces within a macroeconomic regulatory framework that provides companies and work forces with the incentives to raise productivity with the objective of generating mutual growth in real profits and wages. Such a policy needs to remain vigilant to avoid policy increasing the risks to entrepreneurs wishing to introduce innovations to raise productivity.
Rather than introducing red tape, policy incentives need to provide companies with the freedom to allocate resources to maximize their contribution of real incomes for corporate ownership and the workforces both as employees and as consumers.
The process should also support a development of more-for-less production systems in order to reduce costs as well as reduce the pressure on natural resources including GHG emissions. Productivity is central to this mission. |
|
|
All conventional instruments under what is an Aggregate Demand (AD) paradigm (See Note 2) assume that inflation is a demand-pull phenomenon. As a result, all of the policy instruments are designed to manage the economy on the basis of the management of aggregate demand which was and is equated with the amount on money in the economy. Nicholas Kaldor & British Industry
In 1966, in his inaugural lecture as Professor of Economics at the University of Cambridge, Nicholas Kaldor explained the importance of an industrial policy to Britain's economic survival.
All of the gadgets, machines and devices used by all sectors of the economy come from industrial and manufacturing sector. Therefore the productivity of all sectors depends to a large extent on the productivity enhancement capabilities of industrial output. Therefore the core of national economic innovation and development lies in the maintenance of a productive and efficient industrial sector.
Kaldor predicted that the advent of monetarism dominating UK macroeconomic policy in 1975 spelled the decline in the UK economy because national industry and manufacturing would be undermined over time. His predictions proved to be correct.
The reason was that a lack of perception of the nature of real incomes depending on productivity and price setting, increasing amounts of UK investment went offshore and investment and productivity in the UK industrial and manufacturing declined along with real wages, creating the depressed zones so often referred to now as in need of "leveling up".
Although asset holders and investors state that offshore manufacturing brings cheaper imports and therefore lowers the cost of living, the associated cost is the decline in UK industrial output and income from export earnings and the associated decline in real wages and rising income disparity associated with increasing levels of poverty. This is the current state of many in the British economy today and this is a measure of the real associated impact of offshore investments. |
|
|
McNeill pointed out that inflation, in the circumstances of 1975, was almost entirely cost-push (rising petroleum prices) and therefore required supply side solutions targeting unit costs and, in particular incentives for companies to change aspects of production including substitution of cost-raising inputs and actions to change technologies and techniques to increase productivity to control or reduce unit costs and thereby reduce the rate of rises in output prices or even to reduce them.
McNeill observed that conventional policies were not able to maintain traction in the sense that whereas inflation might be a target, invariably other states would change, so as to become of more significance than inflation, such as unemployment, the balance of payments, exchange rates, purchasing power of the currency, real income levels or real income distribution. Although this results in changes in policy targets, McNeill called attention to the fact that the unique policy target indicator of such events, in each case, remains the state of real incomes. By focusing on real incomes the necessary adjustments in any policy instruments become more evident. He therefore posited that by establishing real incomes as the policy objective across all sector operations and for constituents that:
- It becomes easier to manage this at the macroeconomic level;
- Policy traction (See Note 3) would become more effective.
With real growth, the zero-sum nature of conventional policies (generating winners, losers and some who remain in a policy neutral impact state) could be replaced by an evolving state of a positive systemic consistency (See Note 4) where all constituents experience a consistent rise in real incomes.
However, there was still the challenge of identifying the specific policy instruments able to bring the objective of stabilizing or raising real incomes a reality. The problem with the existing set of policy instruments was that their only effect was, and is, on the volume of money or aggregate disposable incomes since Keynesianism and monetarism were both aggregate demand management (AD) based. However, there were no mechanisms or cause and effect relationships within AD model to generate rises in real incomes. There existed a faith in "the market" and "competition" in bringing about investment and innovation.
Innovation victim of easy returns
The assumption made by supporters of Supply Side Economics is that lowering of marginal tax rates for high end earners might result in more investment. However, as money is made available at lower interest rates it becomes easier to make higher returns with less assumed risk by "investing" in assets as opposed to "risking" any innovative investment in the production system with less certain returns.
McNeill observed that under stagflation all of the existing policy instruments exacerbated the state of affairs by depressing the economy. He therefore devised a mechanism to augment innovation and productivity over the medium to long term while bringing the benefits of this innovation trajectory in the form of lower unit prices in the short term in a parallel process.
The Price Performance Ratio - PPR
Most economists consider the investment and productivity cycle to be a medium to long term affair after which the benefits in terms of productivity achieving lower unit costs resultes in the setting of more competitive prices feasible. However, then (1970s-1980s), as now (2022-2023), the urgency lies in the need to lower unit prices in the short term to gain an immediate and generalized gain in purchasing power for constituents. The mechainism for such a change is the need for a simultaneous combination of changes in physical productivity and in price performance. To structure these productivity components into a single indicators on performance, McNeill developed the performance indicator of the Price Performance Ratio - PPR which measures the degree to which unit output prices change in response to changes in aggregate unit input costs.
Therefore in simple terms the Price Performance Ratio is estimated using the flowing formula:
| PPR = | δUP |
 |
| δUC |
Where:
PPR is the Price Performance Ratio;
δ UP is the rise in unit price;
δ UC is the rise in aggregate unit cost;
aggregate unit cost is the is the sum total of all variable inputs contributing to unit costs.
The objective of the PPR is to create a direct relationship between price performance (competivity) improvements to the performance of physical productivity improvements. This has different impacts on the resulting state of consumer real incomes and corporate margins.
In terms of real incomes policy the PPR has the following associations in relation to buyers of outputs (consumers):
| Consumer real income impacts of PPR values |
| PPR value | Affect on inflation | Affect on consumer real incomes |
| > 1.00 | Inflation increases | Real incomes fall faster |
| = 1.00 | Inflation remains the same | Real incomes fall |
| < 1.00 | Inflation falls | Real incomes rise |
Therefore consumers and the workforce gains from the state of affairs when the PPR is less than one. In terms of real incomes policy the PPR has the following associations in relation to corporate margins of producers:
| Corporate margin impacts of PPR values
|
| PPR value | Affect on inflation | Affect on corporate margins |
| > 1.00 | Inflation increases | Margins increase |
| = 1.00 | Inflation remains the same | Margins remain stable |
| < 1.00 | Inflation falls | Margins fall |
In this case, companies lose out is PPRs are less than unity (1.00). It is evident that there is a tension between the policy objective of raising consumer real incomes by lowering inflation and the impact of this state of affairs of lowering corporate margins in the short term.
However, under inflationary conditions the price elasticity of demand for products and services, that maintain prices below the rate of inflation, increases significantly. This results in corporate growth as a result of increased consumption and market penetration. However, if companies can raise their productivity sufficiently they can, in many cases, lower unit prices resulting in an even faster rate of market penetration.
Supply side factor market business-to-business and business-to-consumer supply chain impacts
The relationships between goods and service inflation and consumer real incomes are as described above. However, in the case of industrial and manufacturing capital goods, equipment and infrastructure the lower PPRs associated with moderated or reduced prices of suppliers can augment margins of those purchasing such goods as a result of lower variable input and capital goods prices. Therefore, the analysis set out above is less stark and industrial and manufacturing productivity can contribute significantly to the productivity of supply side goods and service activities.
| Margin impacts of capital goods & variable inputs on margins associated with PPR values |
| PPR value | Affect on corporate input costs | Affect on corporate margins |
| > 1.00 | Inflation increases | Margins increase |
| = 1.00 | Inflation remains the same | Margins remain stable |
| < 1.00 | Inflation falls | Margins rise |
Therefore where consumers of industrial or manufacturing companies are the customers of companies that have PPRs of less than unity they gain an advantage. However the companies supplying consumers and other industries and who achieve PPRs lower than unity, there is a reduction in margins but possibly an associated rise in market share resulting from relativelty lower prices.
It therefore becomes evident that industry and manufacturing capital goods and variable input production PPRs have an important contribution to supply side production of consumer goods and services. Indeed, the efficiency and level of capital goods and variable input prices as well as their design and utility in raising the efficiency and productivity of all economic sectors, has a vital role in supporting real incomes growth and real national economic growth.
Note on deflationary conditionsThe above scenarios only relate to the conditions of inflation. Indeed, McNeill's initial proposal for 3P was only geared to this condition. However, Robin Matthews on reviewing a 1981 monograph on 3P noted that it is necessary to include the state of affairs for this policy under conditions of deflation. McNeill introduced the PPR formula for falling prices later (see Note 5) and this transformed 3P into a general macroeconomic policy as opposed to one only addressing inflationary conditions.
Whose real income?Postitive systemic consistencyNational accounts-based economics, budgeting AD monetary policy combine to creates a zero-sum situation where money moves arond the economy in such as way as to create income disparity. Policies tend to create winners, losers and those who somehow remain in a neutral policy impact state.
 Pareto Pareto |
This is because there is an inadeqate growth in productivity and price moderation resulting in someone's gain being represented by someone else's loss.
Economists often refer to a Pareto optimality in an economy where no one can gain more without someone else losing that same amount.
McNeill's Positive Systemic Consistency rejects such a situation as representing, in reality, optimality or efficiency. This might exist in a circumstance of stasis but this is virtually impossible other than in a severe depression because the economy is never, in fact, in equilibrium when there is innovation occuring because more is being produced for less. As a result, the efficient or optimial circumstance is where there is movement driven by innovation providing more for all. |
|
|
In the context of Joseph Schumpter's observation that profits provide the guarantee of future activities and employment, McNeill introduced an overriding strategic national objective element to the purpose of a real incomes policy that remained consistent with the principle of upholding a state of
positive systemic consistency by aiming to:
- Combat inflation by stabilizing and reversing unit price increases;
- Increase the real incomes of company owners, shareholders, management and the whole work force as labour & consumers;
- Increase international competition as measured by increasing the export of consumer and capital goods component of the balance of payments;
- Decrease the levels of income disparity associated with item 2;
- Be evolutionary so as to maintain traction by constantly improving productivity, price moderation and rises in real incomes;
- As a function of item 1 to stabilize or enhance the value of government revenue.
A policy instrument for sustained real incomes growthGiven the vast range of company activities spread across multiple sectors and involving multiple supply chains, and with each company facing a unique set of circumstances with respect to the technologies and techniques used and financial status, it is irrational to consider fixed policy instrument values, such as interest rates or tax rates can have any other effect than to introduce differentials in the ability of companies to respond to policy objectives.
Constitutional considerationsIt is irrational to impose policy instruments that create winners, losers and those unaffected by policy. Even if this effect is relatively small it does have fundamental constitutional implications. These are that government in establishing regulations associated with economic policies should not prevent constituents as corporate owners, employees or self-employed from pursuing their real income objectives and the legal framework should also prevent constituents as corporate owners, employees or self-employed from constraining the ability of others to achieve their real incomes objectives. This summarizes to some extent the role of constitution in being able to provide conditions to support the interests of the state, community and each individual. McNeill coined the phrase, "
positive systemic consistency" to represent that state where all benefit from policy and where the typical zero-sum game static balance sheet approach to policy is done away with.
The Price Performance Levy (PPL) Price Performance Levy (PPL) periods
It is proposed that the PPL would be applied somewhat like Value Added Tax (VAT) on the basis of "Levy periods" these might have to vary according to economic sectors. Based on a resource of knowledge on corporate throughput and PPR performance, work is advancing on an IT-based continual calculation process where periods are replaced by a moving average PPR which in reality greatly enhances the management calculations required for profitable price setting.
|
|
|
It is therefore imperative that policies maintain a consistent objective while allowing companies to adjust their activities freely to accord with their particular circumstances in order to maximize their real incomes. This creates a unique set of conditions for a real incomes policy to satisfy in order to be successful. The role of policy needs to be one of providing an incentive for companies to emphasize a better choice and allocation of capital goods and variable inputs so a to lower their PPRs in the production of goods and services. The incentive provided under this policy regime should therefore consist of a rebate on a levy applied according to the PPR achieved.
Becoming price-setters rather than price-takers
Microeconomics has a specific production theory known as "Marginal Cost pricing" where production is not extended beyond a specific point when marginal return is equal to marginal costs.
Under 3P rather than being price-takers and applying marginal cost pricing companies can become price-setters to establish a maximized benefit from market penetration and a growth in real incomes. Thus, those companies selling at the relatively lower prices for similar products will not only gain market share but their products will enhance the purchasing power of a growing proportion of consumers. |
|
|
The levy (
Price Performance Levy - PPL) can consist of a base rate (B), somewhat like a corporate tax, the levy paid depends upon the PPR achieved. The lower the PPR below 1.00 the greater the rebate. It is suggested that this levy should be designed to allow companies who have extremely low PPRs and very high productivity be permitted to enter a zero levy status. This, therefore, provides a very strong incentive for companies to orientate their investment, procurement and resources allocation to maximize their contribution to their own, and by default, consumer real incomes. To the degree that work forces are also the national consumers this policy not only raises their real incomes but generates an across the board incentive for real purchasing power rises and a more competitive economy.
The basic theory is that a PPL has a base rate B and a correctve formula based on the size of the PPR.
Examples of Price Performance Levy formulaeThere are many ways to create PPL formulae combining the PPR and a basic levy (B) so as to create a lower levy estimate according to the level the PPR falls below unity (1.00). Depending upon the assesment of a manageable rate of PPL decline, formulae can intensify the impact of PPR values or make impacts more gradual. For example a "power" formulae can be of the following form:
PPL = B - (PPR)nWhere:
PPLis the Price Performance Levy to be paid;
B is the basic levy;
PPR is the Price Performance Ratio achieved during a PPL assessment Period.
The Real Incomes Approach provides for a very large range of options for applying PPLs to aggregate incomes according to the PPR. Below two types are discussed. The basic calculation of PPLs is to apply a corrective coefficient based on the PPR value to a Basic Levy expressed as a percentage e.g. 20%.
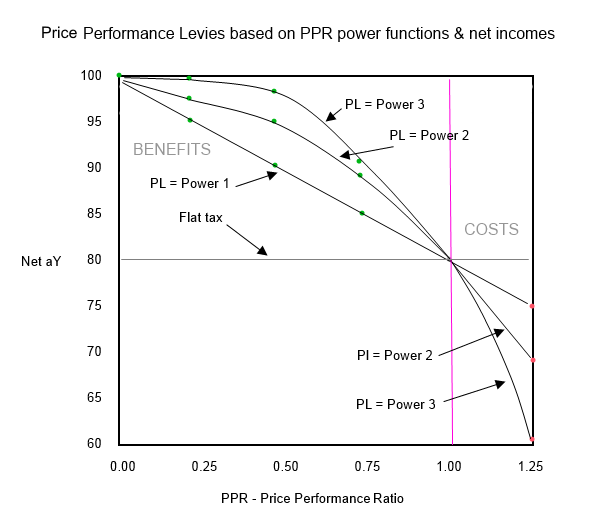
Power functions to intensify impactWhen policy makers wish to change the intensity of size of the incentive to lower PPRs a power function can be used to calculate the PPL value. Thus the table below shows the effect of different PPR power functions on the size of the Levy to be applied to operational margins with a basic levy of 20%:
Some PPL power functions applied to a basic levy of 20%
The percentages indicate the levy to be paid according to the respective PPR
For comparison a conventional tax or flat tax can be assumed to be 20%
| PPR power function |
| PPR1 | PPR2 | PPR3 |
PPR | PPL% | net aY% | PPL% | net aY% | PPL% | net aY% |
0.00 | 0.00% | 100.00% | 0.00% | 100.00 | 0.00% | 100.00% |
0.25 | 5.00% | 95.00% | 1.25% | 98.75% | 0.31% | 99.69% |
0.50 | 10.00% | 90.00% | 5.00% | 95.00% | 2.50% | 97.50% |
0.75 | 15.00% | 85.00% | 11.25% | 88.75% | 8.44% | 91.56% |
1.00 | 20.00% | 80.00% | 20.00% | 80.00% | 20.00% | 80.00% |
1.25 | 25.00% | 75.00% | 31.25% | 68.75% | 39.06% | 60.94% |
| Key: | Benefit | | Flat tax | | Prejudice | |
In these scenarios it can be observed that the rebates increase as the PPR falls below unity (1.00). As the power increases from 1 to 3 the rebates rise for equivalent PPR values. It these cases, the rebates are equivalent to net Levy payments of between 0.31% and 15% while the rate of reduction is higher at the power 3.
 Source: McNeill, H. W., "The Price Performance Levy",
Real Incomes Approach to Economics, APEurope, 2007.
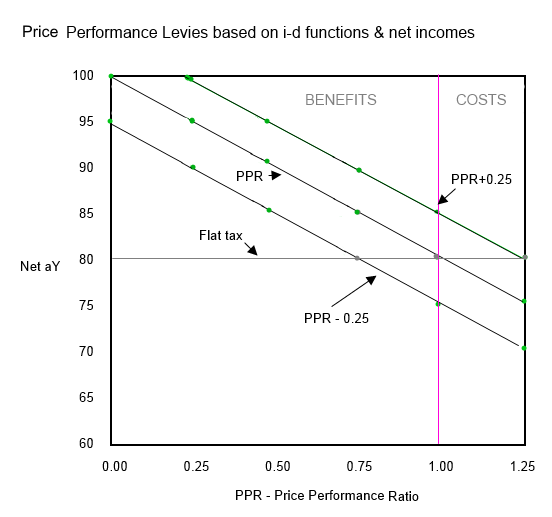
Slide or i-d functions for graduated impactSlide functions raise or lower the PPR value through simple addition or subtraction leading to gentler gradient of PPL values against PPR values.
Some i-d functions applied to a basic levy of 20%
The percentages indicate the levy to be paid according to the respective PPR
For comparison a conventional tax or flat tax can be assumed to be 20%
| PPR | PPR i-c function |
| PPR+0.25 | PPR | PPR-0.25 |
PPR | PPL% | net aY% | PPL% | net aY% | PPL% | net aY% |
0.00 | 5.00% | 95.00% | 0.00% | 100.00% | 0.00% | 100.00% |
0.25 | 10.00% | 90.00% | 5.00% | 95.00% | 0.00% | 100.00% |
0.50 | 15.00% | 85.00% | 5.00% | 95.00% | 5.00% | 95.00% |
0.75 | 20.00% | 80.00% | 15.00% | 85.00% | 10.00% | 90.00% |
1.00 | 25.00% | 75.00% | 20.00% | 80.00% | 15.00% | 85.00% |
1.25 | 30.00% | 70.00% | 25.00% | 75.00% | 20.00% | 80.00% |
| Key: | Benefit | | Flat tax | | Prejudice | |
As would be expected the slide function that increases the value of the PPR raises net tax above the basic 20% while theslide function that reduces the value of the PPR significantly reduces the net PPL paid.
 Source: McNeill, H. W., "The Price Performance Levy",
Real Incomes Approach to Economics, APEurope, 2007.
A note on conventional and flat taxesGovernment revenue-seeking
Under the real incomes policy of 3P where the PPL is deployed there is in fact no corporate taxation so the comparisons with conventional and flat taxes does not really compare equivalent situations but the advantage of 3P is evident.
The more effective 3P is, in moderating prices and raising real incomes, the receipts from the PPL will decline. However, in compensation, real purchasing power of the population will rise meaning that a rising proportion of products and services provided by government can be paid for either directly or through personal incomes tax. Naturally this would require, of course, reasonable rates of pay for employees made feasible by the more efficient allocation of resources and real income generation.
The legislation covering the division of funds assigned to shareholder, executive and labour forces is a topic for another paper in this series. |
|
|
In order to provide a comparison of the relative impacts of Price Performance Levy formulae and conventional and flat taxes one can assume in the above tables that the flat tax or corporation tax is where the PPR values are ignored and the tax remains at 20%. The Real Incomes Approach sets out to compensate companies for their contribution to real incomes whereas flat taxes and conventional taxes are neutral to performance and pay no attention to the contribution of the company to the increase in real incomes. Accordingly irrespective of the performance of a company the tax rate remains the same. Thus a company undergoing significant growth in nominal terms and generating a high return and profits might also be operating in a non-competitive fashion and in fact be a generator of inflation and contributing to the reduction in real incomes. This company will, under a flat tax regime pay the same tax rate as a company investing and achieving higher performance in terms of contribution to real incomes.
Under a Price Performance Policy examples of the benefits accruing to companies who contribute to real incomes levels can be observed in the tables above and the accompanying graphs. Under the flat tax the net of tax is the remaining 80% of profits. In the case of 3P net of tax income can vary from 80%-100% of gross profits, that is, levies of between 0% and 20% for PPRs below unity (1.00).
Combining simultaneous price moderation or reduction with rising innovation & productivityThe past processes of innovation were in essence an involvement in the development of a series of increasingly refined prototypes. Until one was made that was decent enough to sell. From user reactions or even accidents, yet further refinements would be added as the volume of production and sales increased. This stepwise process involved quite often minor adjustments to prototypes such as tightening some fixture or altering some aspect of a device. As a result a good deal of the evolving innovation did not require finance, but rather, the concentration of effort to get some aspects of the desired changes right.
Today there is often the assumption made that innovation requires considerable financial investment and an ambitious project where everything has been detailed up to the final product. Even more notable, is that large amounts of money is sunk into science projects whose results are in fact unknown and success uncertain. However, they are supported because they hold out "promise".
Today we face a serious cost of living crisis which has been, to a large extent, policy-induced as a result of government policy makers' dedication to the AD model and the flawed Quantity Theory being applied as a basis for making decisions in the domain of monetary policy. There is an urgent need to combine advances in innovation with price reductions in close to real time with immediate delivery.
3P achieves this by maintaining a positive systems consistency by only providing PPL rebates in those cases where the desired result, moderated prices or reduced prices are achieved. Companies remain completely free to design the strategies and tactics applied to ahieve a lower PPR through judicious decisions and changes in operations productivity.
Normally investments leading to innovation and lower costs are undertaken with the objective of lowering prices only when the implemented changes achieve the desired costs reduction. Under 3P companies are encoureged to lower prices at the beginning of the investment period, before the costs reduction has been achieved, and then to dedicate effort to costs reduction via a series of means, to justify the price reduction in commercial terms. In the meantime, the company benefitsfrom the PPL rebate. There is no compulsion or control by government on how this is to be achieved. Companies are left to their own devices to set prices, procure, assign and allocate resources as they consider to be appropriate while taking any additional costs into account in the calculation of the PPR.
Income-price elasticity of consumptionThe 3P policy environment requires that more attention is paid to the income-price elasticity of consumption of products and services (See Note 6). This entails analysing collected data on the relationship between the range of disposable incomes and then the range of price elasticities of consumption associated across this range in order to undertsand the "consumption schedules" to be expected with different unit prices. This provides a basis for determining the accessibility of products, according to price, to the population (See Note 7). This also provides a basis upon which to calculate potential volumes of sales associated with feasible prices. This provides a basis to select the most advantageous prices to be used in influencing the value of the PPR so as to maximise income within lower PPR bands.
Real time accountingAll of the calculations for periodic PPRs and PPLs occur in real time as opposed to annual accounts and tax payments. PPL is more like a VAT payment assessed on a regular basis.
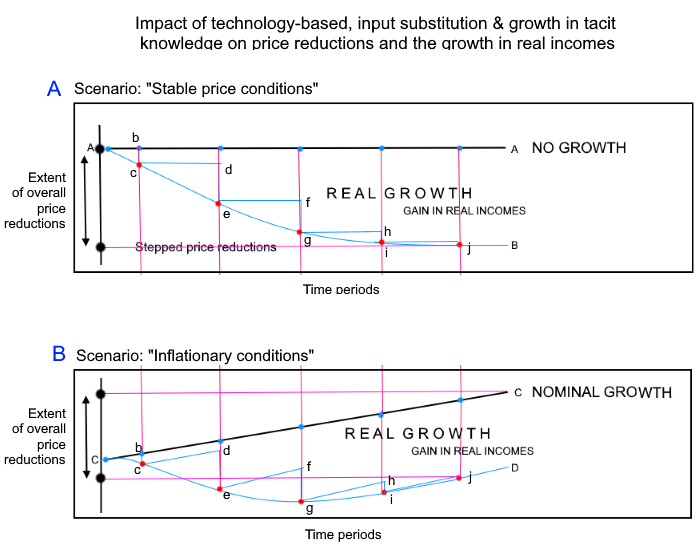
Illustrations of scenarios generated by corporate responses to 3P The diagram below illustrates the concept based on a Real Incomes Policy applying PPR and PPL policy instruments.
There are two diagrams one (A) in a stable price situation and in (B) rising input cost inflation requiring a price response.
The process of price reductions takes on a saw tooth ratchet appearance. So in each case starting with position b in each diagram there is a price drop to c which continues to d and then another price reduction to e whch continue to f and then drops again to g and then to h and a drop to i. According to the Learning Curve (Wright's Law) a diminimishing return to learning is shown with each drop being smaller. The differences between the price line AA in diagram A and AB is the gain is real growth and incomes arising from the process of price reductions. In diagram B the same sequence is shown but because input costs are rising, between each price reduction the company illustrated is coasting along maintaining a PPR of 1.00 between each price reduction so there is a see saw effect on prices. Because of the diminishing returns of the Learning Curve is can be seen that beyond point g prices begin to rise again. This indicates that relying solely on the learning curve might not be sufficient and the application of explicit knowledge, examining internal and external logistics and the applicatiomn of IT to manage data systems better need to come into play in an integrated fashion to secure raised efficiency and productivity to enable further price reductions.
 Government revenue
Although, in terms of government revenue-seeking, in a growing economy this represents a decline in nominal revenue, unlike the case with supply side economics, the opportunity cost of that "lost revenue" is an immediate rise in real incomes across the economy arising from the increased purchasing power generated by lower unit prices.
Rather than analyse this from the normal budgetary basis it is important to measure the impact on national real income and the value of the currency (in terms of purchasing power) and to account for this impact in terms of budgetary expenditure also benefiting from an increased purchasing power of funds spent by the public sector.
Public sector performanceOne of the other policy proposals that emerged during the period during which the Real Incomes Approach was developed is "supply side economics" a theory and policy largely developed by the Canadian economist Robert Mundell. Although, carrying the name "supply side economics" it is far less supply side oriented than the Real Incomes Approach. The basic theory is that by reducing marginal taxation rates in the higher bands there would be more money available for investment and raising productivity to facilitate price reduction and to combat inflation. Recalling the Real Incomes Policy objective of:
- Combating inflation by stabilizing and reversing unit price increases;
- Increasing the real incomes of company owners, shareholders, management and the whole work force;
- Increasing international competition as measured by increasing the export of consumer and capital goods component of the balance of payments;
- Decreasing the levels of income disparity associated with item 2;
- The policy needs to be create incentive to maintain a constant evolution in productivity and rises in real incomes so as to maintain traction;
- As a function of item 1 to stabilizing or enhancing the value of government revenue.
Supply side economics made no such provisions other than being associated, by some economists, with what became known as the Laffer Curve which simply traces out the revenue received against a range of taxation from 0 to 100%. Obviously this creates a revenue curve which increases up to a point in association with rising tax rates and then, beyond this point, declines for a range of reasons such as previous bands having removed all taxable margins or disposable incomes and because of an increasing motivation for people and companies to intentionally misreport earnings and accounting to reduce the amount of funds subject to taxation.
In terms of public sector budgets a policy that reduces tax without ensuring ways to enhance real growth is likely to end up with a deficit and raised borrowing requirement to maintain public expenditure are previous levels. On the other hand, "fiscal neutrality" might not be desired for ideological reasons with the aim to reduce public service budgets. The first experiment with this intent with supply side economics under the Conservative government of Margaret Thatcher was combined with such an intent to reduce the "public sector". In the USA, the Reagan administration carried out the same policy. In the cases of both countries there was a failure to secure any form of positive systemic consistency since income disparity rose with no equivalence between real income changes of company owners, shareholders, management and the whole work force. Higher income individuals experience a high growth rate in income and lower income segments far lower growth rates. In both the UK and US cases, supply side economics was combined with a policy of extremely high interest rates with the intent of applying the aggregate demand management reduction component while the taxation regime was augmenting, in theory, funds available for investment. It was these contradictory elements within a single policy framework that caused an initial recession as well as rise in unemployment. A predictable associated effect in both countries was a very significant rise in house repossessions in the UK and USA as well as family farm repossessions in the USA.
In most cases what were mortgages taken out in good faith and whose financial criteria and lender eligibility criteria were considered to be sound, were transformed into the equivalent to sub-prime mortgages as a direct result of government economic policies. This serious disruption, directly attributable to bad government decision making, was never considered to be a basis for government compensation for the prejudice suffered. These cases, as well as a large number of bankruptcies, loss of businesses and employment are the collateral damage of the combination of a fiscal policy variant called supply side economics and a monetary policy decision to raised interest rates to very high levels.
Supply side policyMcNeill considers the unfortunate combination of high interest rates with the supply side economics fiscal variant, ended up undermining the possible impact of supply side economics. As a result of the depressive impact and significantly reduced purchasing power of the middle to lower income segments prices and inflation did slowly adjust downwards. On the other hand any rises in productivity appear to have been temporary because the balance of payment in goods gained a little and then since this period has continued to decline in both countries. As a result it is reasonable to state that supply side combined with monetary principles failed all of the tests set out for Real Incomes Policy.
TractionThe fact that the United Kingdom has been unable to keep the balance of payments in goods in equilibrium or positive ove a period of over 40 years when this important indicators has constsntly declined, indicates a lack of policy traction. Since the change in policies from Keynesianism in 1975 to a dominance of monetarism and supply side economics gaining ground through the 1980s it is apparent that the real incomes of lower income groups have continued to decline. One reason for the lack of traction attributable to monetarism is that the Quantity Theory of Money, the basic identity showing what monetarists consider to explain the relationship between money volumes and prices, was shown by McNeill to have no logical coherence or value because it contains none of the variables which represent assets into which most of the funds released under quantitative easing flowed. McNeill created an alternative money theory referred to as the Real Money Theory. A slide sequence explaining
the development of the RMT and its significance can be accessed here.
Notes:
Note 1: McNeill, H. W.,
"Price Performance Fiscal Policy - A Real Incomes Approach" , INTERCOMEX (Intercâmbio Internacional de Mercadorias Ltda - International Commodity Exchange Limited), Rio de Janeiro, June 1976.
Note 2: Formalised by John Maynard Keynes, the Aggregate Demand paradigm created an association between aggregate demand and employment. Monetarists linked aggregate demand to economic growth. The economic theories and policy practice that come under the general rubric of the Aggregate Demand paradignm include: Keynesianism, Monetarism, Supply Side Economics and Modern Monetary Theory.
Note 3: Traction is the operational state of a policy where the objectives are attained to the desired degree within the stated time frame and budget.
Note 4: Positive systemic consistency is the state where all constituents within an economic system are benefit from a policy unlike the notion of Pareto efficiency of the state that any person can only gain at the cost of another person. See
"Positive systemic constistency"Note 5: A PPR for falling price, deflation, see:
The Price Performance Ratio
Note 6: Income-price elasticity of consumption introduced as stratification into what is generally assumed to be average price elasticity of consumption. This is animportant detail given the overall approach of the Real Incomes Approach bbeing based on the Production,
Accessibility & Consumption paradigm.
Note 7: Accessibility of products and services is an important consideration in the PAC model of the economy where accessibility refers to access to market information on a product or service, the accessibility of prices to disposable incomes and accessibility in terms of proximity to point of delivery and service.