Appropriate Pricing Models
Hector McNeill
SEEL
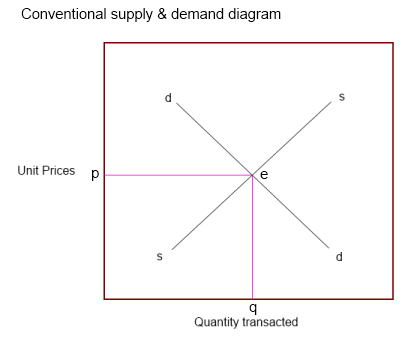
Pricing models linked to market strategies often consist of price projections based upon a conventional representation of "supply and demand" (see the box on the right). This conventional notion of supply and demand, as represented by the diagram in the box, does not provide an effective basis for decision analysis for corporate strategy nor policy-making at the macro-economic level1.
In order to understand what appropriate pricing models are it is necessary to analyse the motivations and the constraints on:
- those who purchase, rent or borrow goods, services and money
- those who produce, rent out or lend goods, services and money
Fundamental challenges
Lying underneath, the misleading representation of supply and demand (see box) and therefore hidden, is a highly complex dynamic situation associated with economic transactions between economic units and their customers each associated with unique conditions according to location, time and the state of affairs of the buyers and the sellers. Conventional statistical surveys and analysis have some difficulty tracing all of the relevant factors relevant to a transparent analysis. Paradoxically, this lack of information is not crucial because those involved in transactions will undertake them anyway irrespective of "statistics" and usually in spite of macro-economic policy objectives, with transactions taking place in a manner to avoid negative impacts of policy on their economic status.
If a market is free it will not be coordinated nor driven by macro-economic policy but by the preferences of the participants. However, there is no underlying fairness or equity in the market and the role of large corporate interests and globalization have combined to replace the notion of "each pursuing their own interests" along the lines of Adam Smith's theory by a widespread and significant distortion associated with economic disadvantage on the part of many market participants. Disadvantage, in this context, would be paying higher prices than necessary or than would prevail if such distortions did not exist. It is therefore necessary to re-evaluate market theory by building a representative model that is both logical and transparent and where all such effects can be represented and analysed.
First order challenge
In order to develop relevant and effective macro-economic policy it is necessary to analyse the costs of production of economic units as well as the aggregate income "space" of those who consume output. These parameters establish the operational envelope within which all transactions will occur and therefore enable a representation of alternative marketing strategies within the diagram.
Second order challenge
It is necessary to be able to represent all types of company within a sector within one diagram in order to effect comparative analyses with respect to differentiation between such economic units in terms of market growth, income and profits.
Third order challenge
It is necessary to trace the overall effects of an economic unit's transactions upon the relative benefits of their consumers in terms of
the terms of transactions in comparison with the customers of other economic units.
Fourth order challenge
It is necessary to aggregate these performance maps across a sector and then across sectors to generate a macro-economic map where the impact of alternative policy instruments can be compared in a transparent fashion.
In this way, outcomes of ,corporate strategies can be trace to policy constraints or incentives. However, the starting point should not be the presumptions of top-down macro-economic aggregate demand models (for goods, service & money) but rather a review of the costs and productivity dynamics and how these affect corporate performance and real income levels as an outcome of specific pricing decisions.
The outcome of this analysis is summarised in the three diagrams are shown below:
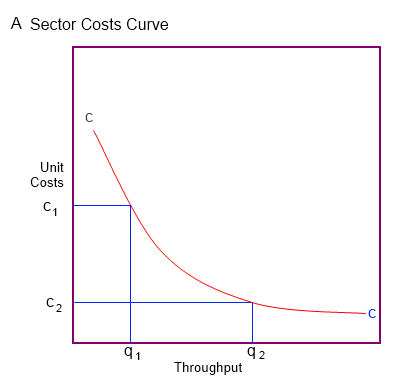
- Diagram A shows a sector production costs curve. This can be generated by relating the capacity of each participant, returns to scale, capacity utilization, input costs and the production function, according to technologies deployed. Starting with dominant companies a sector costs curve is generated by summing the throughputs of each economic unit.
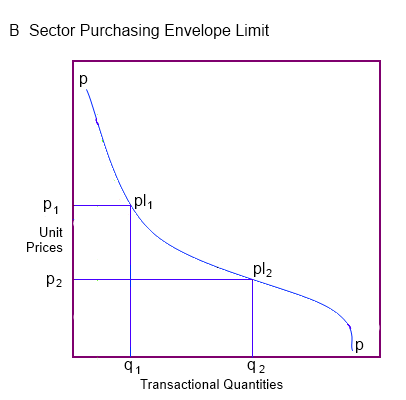
- Diagram B is the population income distribution curve as purchasing power, that is the volumes likely to be consumed at each unit price for the sums allocated to the sector output.
- Diagram C is the "Sector Transactional Envelope" that is mapped out by overlaying of the sector costs curve and the population purchasing power curve, taking into account specific microeconomic concerns and consumer concerns the market prices can occur anywhere within this envelope
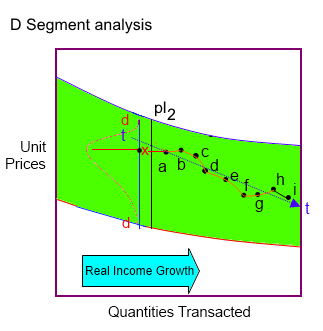
The Real Incomes dimension & EquilibriumThe way in which the market should act so as to generate increasing real growth and real incomes is for the economic units to reduce their unit prices so as to fall some distance below the purchasing power envelope upper limit for any aggregate level of transactions (throughput). The more this movement can be accomplished the more competitive will prices become driving up the number of transactions by shifting the "equilibrium point" to the right. This also signifies that a large proportion of the consuming population is enjoying lower unit prices, more purchasing power on a fixed nominal income and therefore a rise in real incomes.
Decision-making at the economic unit level needs to balance the lowering of unit prices to gain market penetration against unit profits and transaction volumes. In terms of the management of investment returns management needs to balance the allocation of efforts to set unit prices and take actions to optimise the trajectory of corporate profits. This has very little relationship to the conventional supply and demand analysis nor does it relate to static vertical cost structures (accounts) but is more directly related to tactics related to cost reductions achieved through returns to scale, the refinement in techniques accomplished as a result of learning, and investment in more productive technology and work methods/techniques.
As can be readily appreciated, none of these considerations can be analysed effectively using the conventional supply and demand curve. On the other hand, the diagram showing the sector transactional envelope can be used to accommodate all of the analytical challenges identified, as long as the detail is sufficient to be able to simulate different pricing strategies based upon Segment Analysis.
The Real Incomes Approach As can be readily appreciated the conventional supply and demand curve assumes production will increase if unit prices rise. This is why many assume growth can only occur through "extra" funding or finance both on the corporate and consumer sides. The driving force for increased supply is the prospect of higher unit prices, or inflationary conditions. However, the reality is that supply side management decision-making can drive growth of unit profits and real income levels of consumers while unit prices fall.
There is a profound difference between real incomes growth and conventional views of growth that refer to growth in nominal aggregate income which counts in inflation and interest rates. Over the medium to long term conventional policies undermine purchasing power and growth in real incomes. This misguided economic foundation has resulted in the Pound Sterling now being worth less than 4% of its value in 1945.
1 In 1975, in the wake of a failure in Brazilian macro-economic policies in the face of petroleum price hikes I was unable to identify sound policies in the Keynesian or Monetarist "tool boxes" to solve these issues as well as those of slumpflation evolving in the United Kingdom. I therefore initiated a complete review of supply and demand theory to identify why such macro-economic approaches lack practical analytical components that could provide policy traction. The objective of this exercise was to identify appropriate pricing models upon which to base microeconomic decisions directed at growth and efficiency and then to aggregate the microeconomic model into a macroeconomic model which retained the micro-economic decision analysis imperatives. This work resulted in the document,
"Price Performance Fiscal Policy - A Real Incomes Approach", Rio de Janeiro, 1976.